
Code review reads what was written and approves what looks right: typed, error-handled, sensibly named. A good test suite goes further: unit and integration tests in CI, often run locally before the PR even goes up, cover the behaviour you thought to check. What neither reliably reaches is how the system behaves when a disruptive event lands in the middle of normal operation and the outcome isn’t obvious from the source: the recovery path nobody exercises, the retry that races, the half-committed state after a peer disappears mid-write. Those paths are genuinely uncertain until you cause the event, and they surface only when the system is running under it — not in a diff, and rarely in a test that would have to stand up the condition on its own first.
These are the events any distributed system eventually meets: a network partition, a peer that vanishes for ninety seconds and comes back on a stale fork, a disk that starts returning bytes slowly, a clock that drifts past the consensus timeout. What each one does to a Polygon PoS validator’s consensus and block production is genuinely uncertain until it happens. You can’t read it off a unit test or a diff. The only way to find out how Bor and Heimdall behave under those conditions is to put them under those conditions and watch.
That’s what chaos-utils does. It’s a
chaos-engineering framework that injects faults into a local Polygon PoS devnet and
checks (against Prometheus metrics, not intuition) how block production and
consensus hold up under fault. This post walks through what it is, runs real
experiments against a live PoS devnet end to end, and then covers the other half of
the story: once an agent is running these experiments, how do you evaluate what it did
after the fact, rather than monitoring the run line by line? That’s where
Vessel comes in.
What chaos engineering actually is
Chaos engineering is older and more disciplined than its name suggests. Netflix pioneered the practice in the early 2010s with Chaos Monkey, a process that killed production instances at random so that surviving a lost instance became a property the system was forced to have, not a thing everyone hoped was true. The practice has a canonical set of principles: build a hypothesis around steady-state behaviour, vary real-world events, and, the part people skip, minimize the blast radius so an experiment can’t become an outage.
The key word is hypothesis. A chaos experiment is not “let’s see what breaks.” It’s a falsifiable claim: “the chain keeps producing blocks and committing consensus while one validator is completely cut off.” You define a measurable steady state, you state that it will hold under a specific fault, and then you inject the fault and let the metrics say whether you were right. It is the runtime, falsifiable counterpart to review and testing: those read the code and check the behaviour you anticipated, while the experiment runs it under the exact conditions where it’s most likely to quietly break.
chaos-utils, briefly
chaos-utils is a Go program built around a declarative scenario. You describe, in YAML, which services to hit, what fault to apply, and what “still healthy” means as a set of Prometheus queries. The runner does the rest through an eleven-phase state machine (discover, pre-check the steady state, warm up, inject, monitor, cool down, tear down, then evaluate) plus a few hard invariants that keep an experiment from turning into an incident:
- The observability plane is never a target. Any selector that resolves to Prometheus or Grafana is rejected at discovery time. You cannot accidentally blind yourself mid-experiment.
- One validator is a reserved fault target. By convention validator 4 takes the damage, and the success-criteria queries scope to the other validators, so a partial outage and a total outage never look the same to the evaluator.
- Teardown runs before evaluation. Faults are removed first so Prometheus can
scrape cleanly, and a post-run verifier checks that no
tcqdisc,iptablesrule, or leftover sidecar survived the run.
Faults are injected from a per-target sidecar container that shares the target’s
network namespace and carries the low-level tools: tc netem and iptables for
L3/L4, Envoy for L7, plus a small custom binary for JSON-aware RPC corruption and
devp2p-level fault injection. The catalogue is broad on purpose: network latency and partition,
packet loss and reorder, CPU and memory pressure, disk throttling and corruption,
clock skew, container kills, semantic corruption of Bor RPC and Heimdall REST
payloads, sustained transaction load, and forced governance transitions. Most of
them map directly to a technique from Jepsen, Kyle Kingsbury’s
long-running body of distributed-systems torture tests.
A scenario is small enough to read in one screen. Here’s the core of the one we’re about to run: isolate a validator completely, then measure that the rest of the network carried on:
spec:
  targets:
    - selector: { type: kurtosis_service, enclave: "${ENCLAVE_NAME}", pattern: "l2-el-4-bor-heimdall-v2-validator" }
      alias: bor_4
    - selector: { type: kurtosis_service, enclave: "${ENCLAVE_NAME}", pattern: "l2-cl-4-heimdall-v2-bor-validator" }
      alias: heimdall_4

  duration: 2m
  warmup: 30s
  cooldown: 30s

  faults:
    - phase: isolate_bor_4        # drop all Bor devp2p
      target: bor_4
      type: connection_drop
      params: { rule_type: drop, target_ports: "30303", target_proto: tcp, probability: 1.0 }
    - phase: isolate_heimdall_4   # drop all CometBFT P2P
      target: heimdall_4
      type: connection_drop
      params: { rule_type: drop, target_ports: "26656", target_proto: tcp, probability: 1.0 }

  success_criteria:
    - name: majority_continues     # steady-state hypothesis AND resilience claim
      type: prometheus
      query: min(rate(chain_head_block{job=~"l2-el-[123]-bor-heimdall-v2-validator"}[1m]))
      threshold: "> 0"
      critical: true
    - name: consensus_continues    # Heimdall keeps committing with 3/4 (> 2/3)
      type: prometheus
      query: sum(increase(cometbft_consensus_height{job=~"l2-cl-[123]-heimdall-v2-bor-validator"}[2m]))
      threshold: "> 0"
      critical: true
Two critical criteria, both about the healthy set. The same chain_head_block
that gates the pre-fault steady state carries the resilience claim during the cut,
and consensus height proves Heimdall keeps committing with 3/4, comfortably over the
2/3 BFT line. That’s the entire hypothesis, and it’s deliberately narrow: cut one
validator off completely, and the other three don’t miss a block. The isolated node’s
stall is reported for free: chaos-utils auto-injects a set of universal PoS liveness
monitors, and one of them names l2-el-4 as stalled for exactly as long as it’s
partitioned.
Running it against a real PoS devnet
The substrate is a local Polygon PoS network stood up with
kurtosis-pos. For this run: four
producing validators (a 3/4 honest majority, comfortably above the 2/3 BFT threshold),
a full-sync RPC node, an anvil L1 to keep the box light, and the observability stack
(Prometheus, Grafana, Panoptichain):
kurtosis run --enclave pos . \
  --args-file args/4val-anvil-stable.yaml
A few minutes later the chain is producing steadily — all four validators tracking the same head, Heimdall committing heights in lockstep. That’s the steady state the experiment will hypothesize continues. Then one command runs the scenario above (the whole thing is a single, self-contained declarative YAML):
export ENCLAVE_NAME=pos
./bin/chaos run --scenario pos-validator-isolation-demo.yaml --enclave pos
The runner discovers the target containers by their Kurtosis service labels, spins
a sidecar into each target’s network namespace, drops all devp2p (30303) and
CometBFT (26656) traffic to validator 4, and then just watches:
[INJECT] Injecting faults...
  ✓ isolate_bor_4 on l2-el-4-bor-heimdall-v2-validator
  ✓ isolate_heimdall_4 on l2-cl-4-heimdall-v2-bor-validator
✓ Verified 2 fault(s) active
[MONITOR] Monitoring for: 1m30s
[COOLDOWN] 30s (fault still active)
[TEARDOWN] Removing 2 faults...
[DETECT] Evaluating success criteria...
  ✓ PASSED  majority_continues                    value 1.00     > 0
  ✓ PASSED  consensus_continues                   value 257.14   > 0
  ✓ PASSED  [universal] block_hash_agreement      healthy set agrees on every block
  ✓ PASSED  [universal] no_byzantine_validators
  ✓ PASSED  [universal] no_panic_or_consensus_failure   bor · heimdall
  ✓ PASSED  [universal] no_db_corruption               bor · heimdall
  ✗ (non-critical) universal-liveness             l2-el-4 stalled while partitioned

  Cleanup: 8 succeeded, 0 failed
Watching it live, the split is immediate and total: the three healthy validators keep climbing in lockstep, and the isolated validator’s head simply goes flat — cut off from the set, it has nothing to extend and nothing to commit, exactly as a validator severed from a live majority should behave. Then the partition heals and the picture completes itself: the isolated node re-peers, re-syncs the gap it missed in one steep catch-up, and rejoins the set at the same head. There is nothing subtle to interpret: three lines rising together, one flat, then a fourth snapping back into line, and every consensus-safety check stays green for the entire fault window.
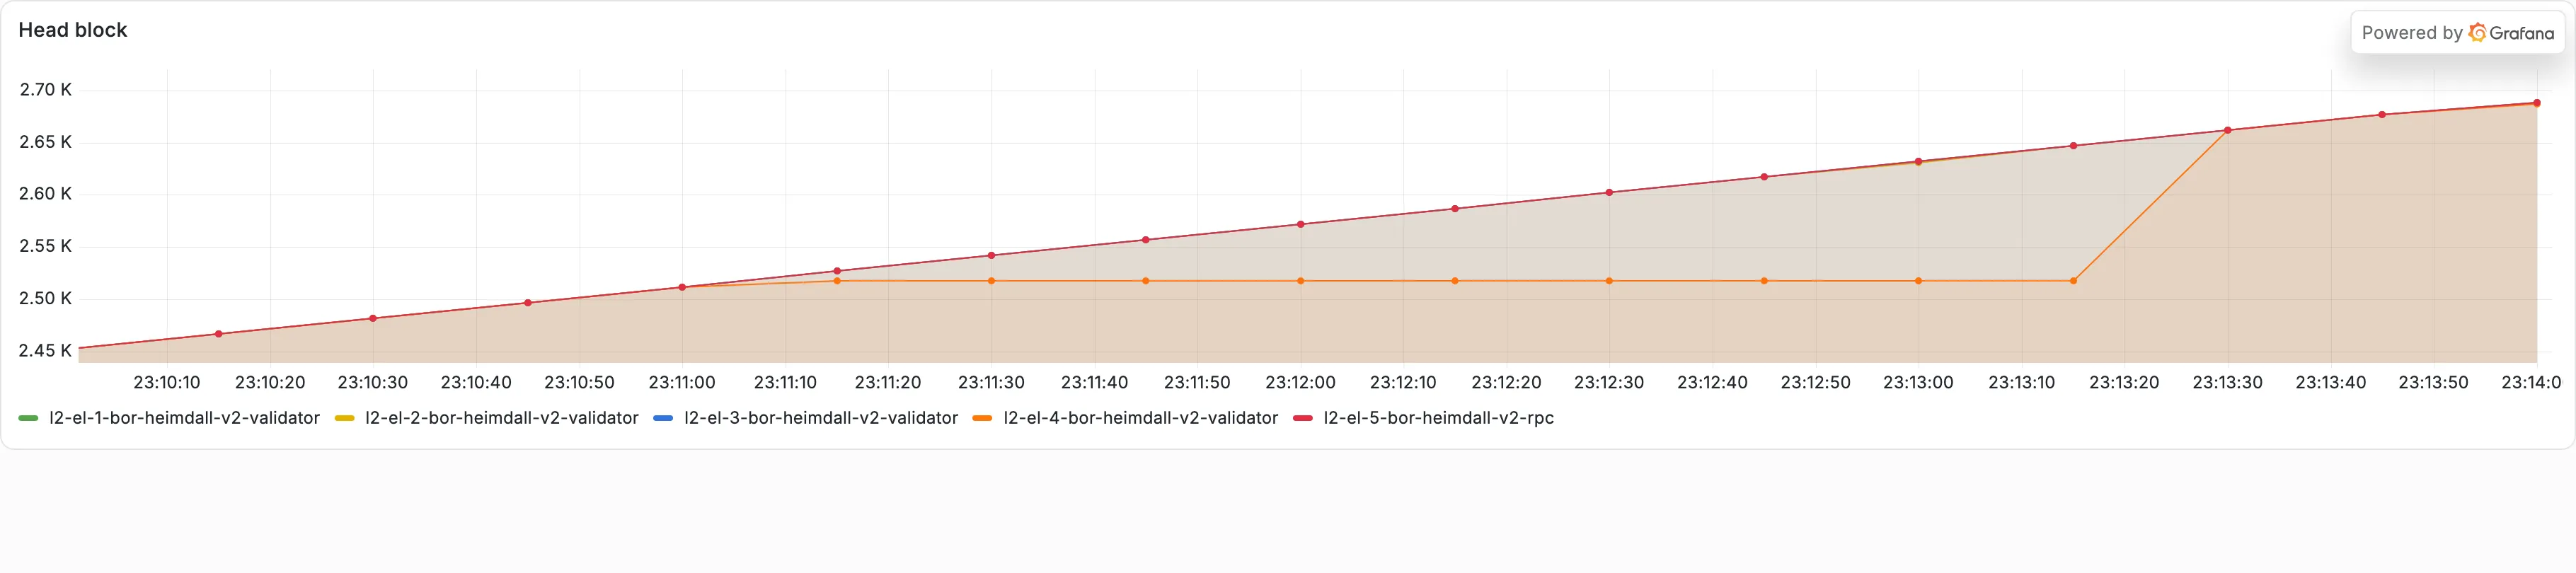
When the run ends, chaos-utils writes a JSON report and a self-contained HTML summary into a per-run bundle: targets, faults injected, every criterion’s pass/fail against its query, and a cleanup audit confirming the fault was fully torn down. That bundle is the artifact you actually review; you didn’t have to watch any of it happen, and because the verdict is in the JSON, the same result is what an agent reads back when it triages the run later.
The measurement is the point: “the network absorbs the loss of a validator” went from something we expected to something we saw in the metrics, and because the scenario is declarative and self-contained, it’s repeatable: the same YAML yields the same verdict run after run, on a laptop or in CI, which turns a one-off observation into a regression test you can keep. The same harness generalizes to much harder cases: combinations of load, timing, and topology change that stress the exact seams where execution and consensus meet. Those seams are where the most valuable learnings live.
Going deeper: composing faults
A single clean fault is the easy case. The situations worth learning from are the messy, overlapping ones: the validator whose peer connections are dropping packets at the same moment its CPU is pinned and its consensus messages are arriving late. A real degradation is rarely one tidy fault at a time. The more instructive experiment is a brownout: pile several faults onto one node at once and watch what the rest of the network does.
This scenario does exactly that to validator 4: 400 ms of latency and 50% packet loss on both its Bor devp2p and its Heimdall CometBFT connections, and its CPU pinned at 90% across two cores, all at the same time:
faults:
  - phase: degrade_bor_p2p          # Bor devp2p: latency + loss
    target: bor_4
    type: network
    params: { device: eth0, latency: 400, packet_loss: 50, target_ports: "30303", target_proto: tcp }
  - phase: degrade_heimdall_p2p     # Heimdall CometBFT P2P: latency + loss
    target: heimdall_4
    type: network
    params: { device: eth0, latency: 400, packet_loss: 50, target_ports: "26656", target_proto: tcp }
  - phase: starve_bor_cpu           # pin Bor 4 CPU at 90% across 2 cores
    target: bor_4
    type: cpu_stress
params: { cpu_percent: 90, cores: 2 }[INJECT] Injecting faults...
✓ degrade_bor_p2p l2-el-4 (tc netem: 400ms + 50% loss on :30303)
✓ degrade_heimdall_p2p l2-cl-4 (tc netem: 400ms + 50% loss on :26656)
✓ starve_bor_cpu l2-el-4 (90% across 2 cores)
✓ Verified 3 fault(s) active
[MONITOR] Monitoring for: 1m30s
[COOLDOWN] 30s (fault still active)
[TEARDOWN] Removing 3 faults...
[DETECT] Evaluating success criteria...
✓ PASSED majority_continues value 1.00 > 0
✓ PASSED consensus_continues value 260.17 > 0
✓ PASSED [universal] block_hash_agreement healthy set agrees on every block
✓ PASSED [universal] no_byzantine_validators
✓ PASSED [universal] no_panic_or_consensus_failure bor · heimdall
✓ PASSED [universal] no_db_corruption bor · heimdall
✗ (non-critical) universal-liveness l2-el-4 fell behind under the brownout
Cleanup: 8 succeeded, 0 failed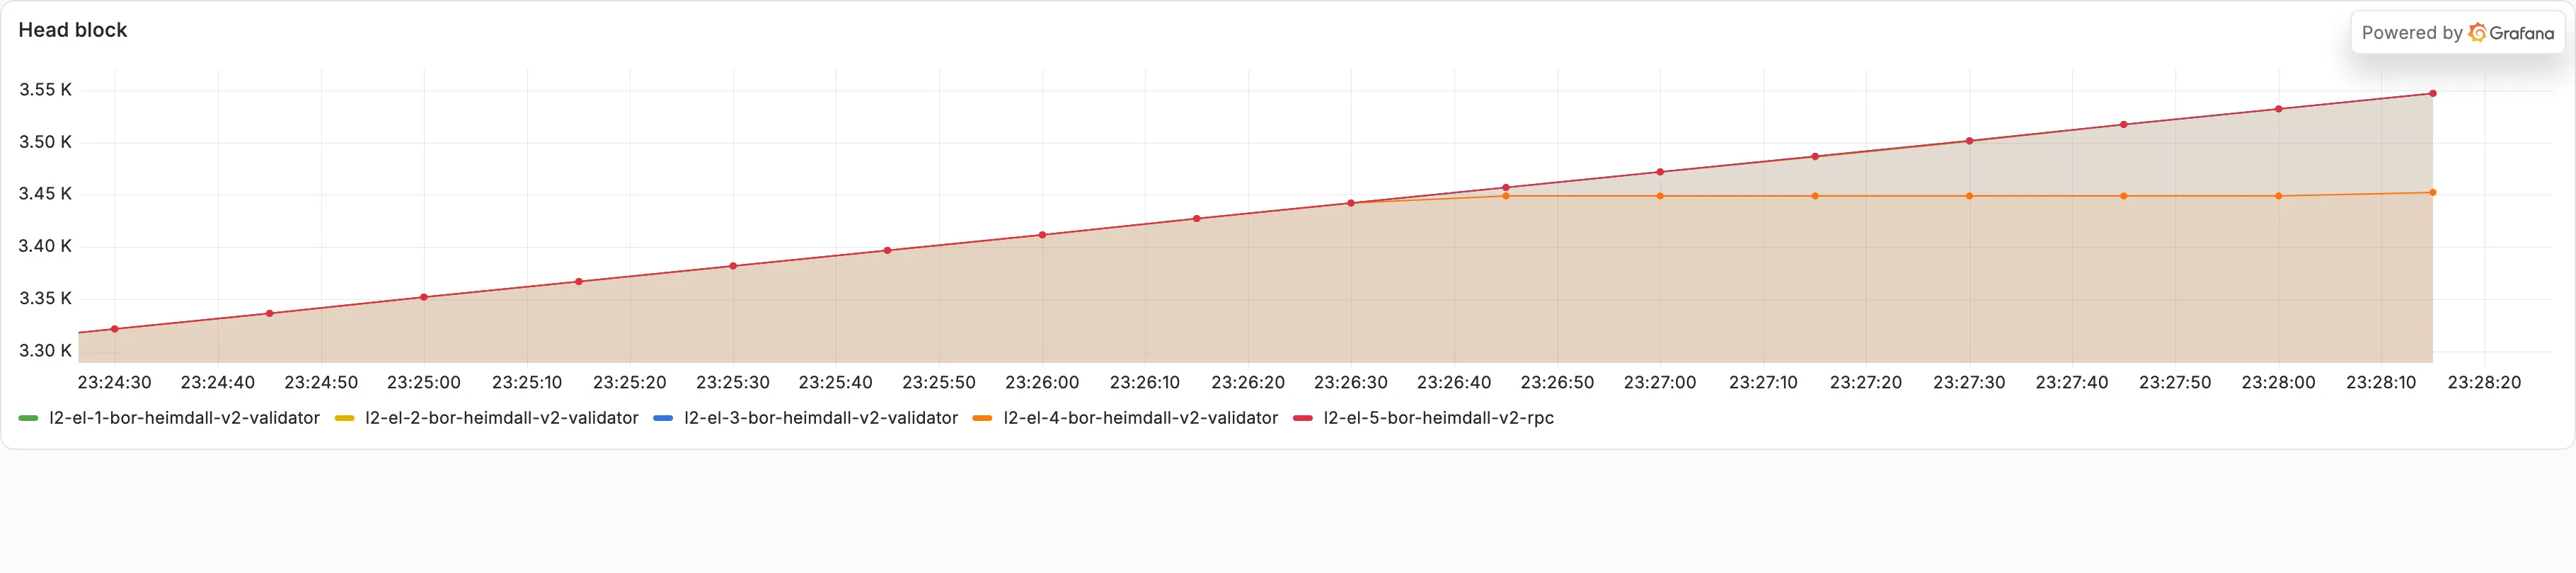
The measured result is the same shape as the clean cut, which is exactly the point: the healthy 3/4 majority produces blocks at full rate and consensus keeps committing while the degraded validator does its slow, hampered best in the background. The learning underneath it is a property of the protocol, not of this run: a set of n Polygon PoS validators keeps making safe progress on its honest supermajority as long as more than two-thirds of the voting power is healthy, and “healthy” is a high bar that a mix of dropped packets, added latency, and starved compute can chip away at just as surely as a clean crash. Compound faults are where the execution and consensus layers are most tightly coupled, which makes them the most instructive thing to exercise, and the hardest to reason about from a diff alone.
Beyond the network: a tour of the catalogue
The two experiments above use network and CPU faults, but those are a small corner of what chaos-utils can inject. Most of the catalogue is the vocabulary any distributed-systems engineer already reaches for:
- Network — latency, packet loss, bandwidth caps, reordering, and Jepsen-style partitions that cut the cluster into disjoint groups.
- Process & container — kill (any signal), restart, pause/resume, and in-namespace process kills.
- Resource pressure — CPU burn, a cgroup memory cap, disk-I/O contention, disk fill, and blkio bandwidth/IOPS throttling.
- Time & L7 — clock skew on a single node, and Envoy-based HTTP aborts and delays at the RPC layer.
That part is table stakes. The features that tend to get a double-take are the ones that understand Polygon PoS specifically:
- Semantic corruption. A JSON-aware proxy garbles Bor RPC or Heimdall REST responses in flight (a state root that doesn’t match, a malformed span) to confirm the consumer validates what it receives and rejects the bad data instead of acting on it. Plenty of tools can drop or delay a packet; very few can hand a node a well-formed-but-wrong consensus message and check what it does with it.
- Forcing a consensus transition. Span and checkpoint boundaries are where a lot of the interesting behaviour lives, and the chain normally reaches them on its own schedule, so chaos-utils can drive a Heimdall span rotation deterministically through the node CLI, firing a boundary-condition test on command instead of after a long wait.
- Production-shaped state growth. A storage-heavy workload pushes realistic state-trie growth into a validator, exercising the pruning and storage paths that only show up once the database is genuinely large.
Each one maps to something that really happens to validators, and each is something you’d otherwise have to wait for, get lucky with, or only meet in production.
Built to be run by an agent
Here’s where it ties back to the opening. chaos-utils’s whole operator surface is designed to be driven by an agent. Scenario authoring, running, and triage are packaged as skills; there are subagent roles for authoring and for triage (the triager enforces a “reproduce it N times before you believe it” gate); the YAML and report formats have JSON Schemas so an agent can validate before it writes; and there’s a named probe library plus per-target findings ledgers so a run’s conclusions persist across sessions.
The loop it’s designed for is hands-off: point an agent at a hypothesis and let it author a scenario, dry-run it, run it for real, and triage the report — across many scenarios, unattended. It’s exactly the kind of work you’d want to be able to hand off and step away from. It’s also the kind of work worth being deliberate about, because “an agent did a lot of things while I wasn’t looking” is not the same as “an agent did the right things.” That distinction is what the second tool is for.
Vessel: see the run, not the log stream
Vessel is local agent observability. It
reads what the agent already wrote (Claude Code transcripts, other CLIs’ usage
ledgers) and reports how long a run took, what it did, and where it hit friction. In
this transcript-only mode it makes no model call, sends nothing over the network, and
sits nowhere near the request path (there’s an optional per-repo proxy for per-call
latency, but you have to explicitly opt a repo into it). You turn it on once:
vessel setup --hooks     # transcript-only - reads what the agent wrote, no model calls
vessel dashboard --open
The one thing to be clear-eyed about is what it deliberately does not do: Vessel is observability, not a correctness grade. It won’t tell you the chaos agent reached the right conclusion. A confidently-wrong run looks perfectly healthy on every number it shows. What it gives you is the shape of the work, so a human can decide where to actually look.
That shape is what makes hands-off practical. Instead of reading the log stream, you open the session afterward and take it in at a glance: how many turns and tool calls it took, how those calls were distributed across tools, and, the part that matters most for deciding whether to trust a run, where it hit friction: tool errors, interrupts, permission denials. Here’s Vessel’s read of a chaos-testing agent session on the same devnet — the agent that read the isolation run’s report and confirmed the majority had held. Four turns, cache reuse well above the floor, and the line that tells you a hands-off run at least executed cleanly, “No friction detected”:
TOKENS      174.2k     174.2k main · 0 subagent
CACHE HIT   79.8%      137.5k read · 34.7k written
ELAPSED     53.7s      working time not recorded
TURNS       4

FINDINGS
✓ GOOD · No friction detected
  No rejected tool calls, no interrupts, no compaction, and
  cache reuse above the floor.
The other thing worth seeing is what it was asked to do. Vessel keeps the exact prompt, so a reviewer can check the instruction as well as the execution:
Triage the most recent chaos-engineering run in this repo. Find the
newest reports/test-*.json, read it, and in 3–4 sentences tell me
whether the healthy 3/4 validator majority kept producing blocks and
committing consensus while validator 4 was isolated. Cite the
majority_continues, consensus_continues, and block_hash_agreement
results. Do not modify any files.
Between the two, you can confirm both halves of a hands-off run, what it was told to do and how cleanly it did it, without reconstructing anything from the full log. If a friction counter had been non-zero, the finding at the top would say which, and you could open the exact turn where it happened.
Put the two together and the loop closes: chaos-utils runs the experiments that exercise conditions a review can’t see, and Vessel makes it practical to let an agent drive those experiments unattended by turning “trust me, it ran fine” into something you can actually check.
The fastest way to see it for yourself is to stand up a PoS devnet with
chaos-utils and
Vessel, isolate a validator, and watch what
your code does when its peers go quiet.
References
chaos-utils stands on a lot of prior art. If you want to go deeper than this post:
- Principles of Chaos Engineering — principlesofchaos.org, the five-principle canon this harness is audited against.
- Chaos Engineering: System Resiliency in Practice — Casey Rosenthal & Nora Jones (O’Reilly), the standard text.
- Jepsen — jepsen.io, Kyle Kingsbury’s distributed-systems analyses; the source of most of chaos-utils’ fault catalogue (partitions, clock skew, process pauses, corruption).
- Netflix Chaos Monkey / the Simian Army — where the practice started, and the origin of “make surviving a failure a property, not a hope.”
- Prior-art tools we borrowed patterns from without adopting their Kubernetes control planes: chaosblade (the target/action fault DSL), Litmus (the named typed-probe vocabulary), and Chaos Mesh (tc-based network primitives).
- Substrate: Kurtosis, Prometheus / PromQL,
and
tc-netem(8).
Why we moved software development into Slack
An agent on your laptop is yours. An agent in the channel is the team's. How Polygon's non-engineers ship code without opening an IDE, and what it took to get there.

Why we moved software development into Slack
An agent on your laptop is yours. An agent in the channel is the team's. How Polygon's non-engineers ship code without opening an IDE, and what it took to get there.
Oct 825 minEveryone at Polygon builds their own agents now. And the best thing we did to help them was get out of the way
We built our colleagues’ agents one at a time until the upkeep quietly became the job. So we stopped building them and handed everyone the platform instead — 12 agents running, 11 in the works, 605 runs last month.

Everyone at Polygon builds their own agents now. And the best thing we did to help them was get out of the way
We built our colleagues’ agents one at a time until the upkeep quietly became the job. So we stopped building them and handed everyone the platform instead — 12 agents running, 11 in the works, 605 runs last month.
Sep 176 minI got tired of downloading HTML files from Slack, so I built Primer
A weekend tool for sharing one LLM-generated document turned into the place the whole company reads, comments on, and iterates with agents on everything they publish.

I got tired of downloading HTML files from Slack, so I built Primer
A weekend tool for sharing one LLM-generated document turned into the place the whole company reads, comments on, and iterates with agents on everything they publish.
Sep 157 min